
A data analyst resume should show how you turned imperfect information into a decision someone could trust. Hiring teams need more than a list of SQL, spreadsheet, and dashboard tools. They want evidence that you framed a useful question, checked the underlying data, selected an appropriate analysis, and communicated the result to the people responsible for acting on it.
Keep the chain visible in each strong example. Name the business question, the scale or source of the data, the method you used, the quality check you performed, and the decision or operating result that followed. This structure separates analytical judgment from routine report production.
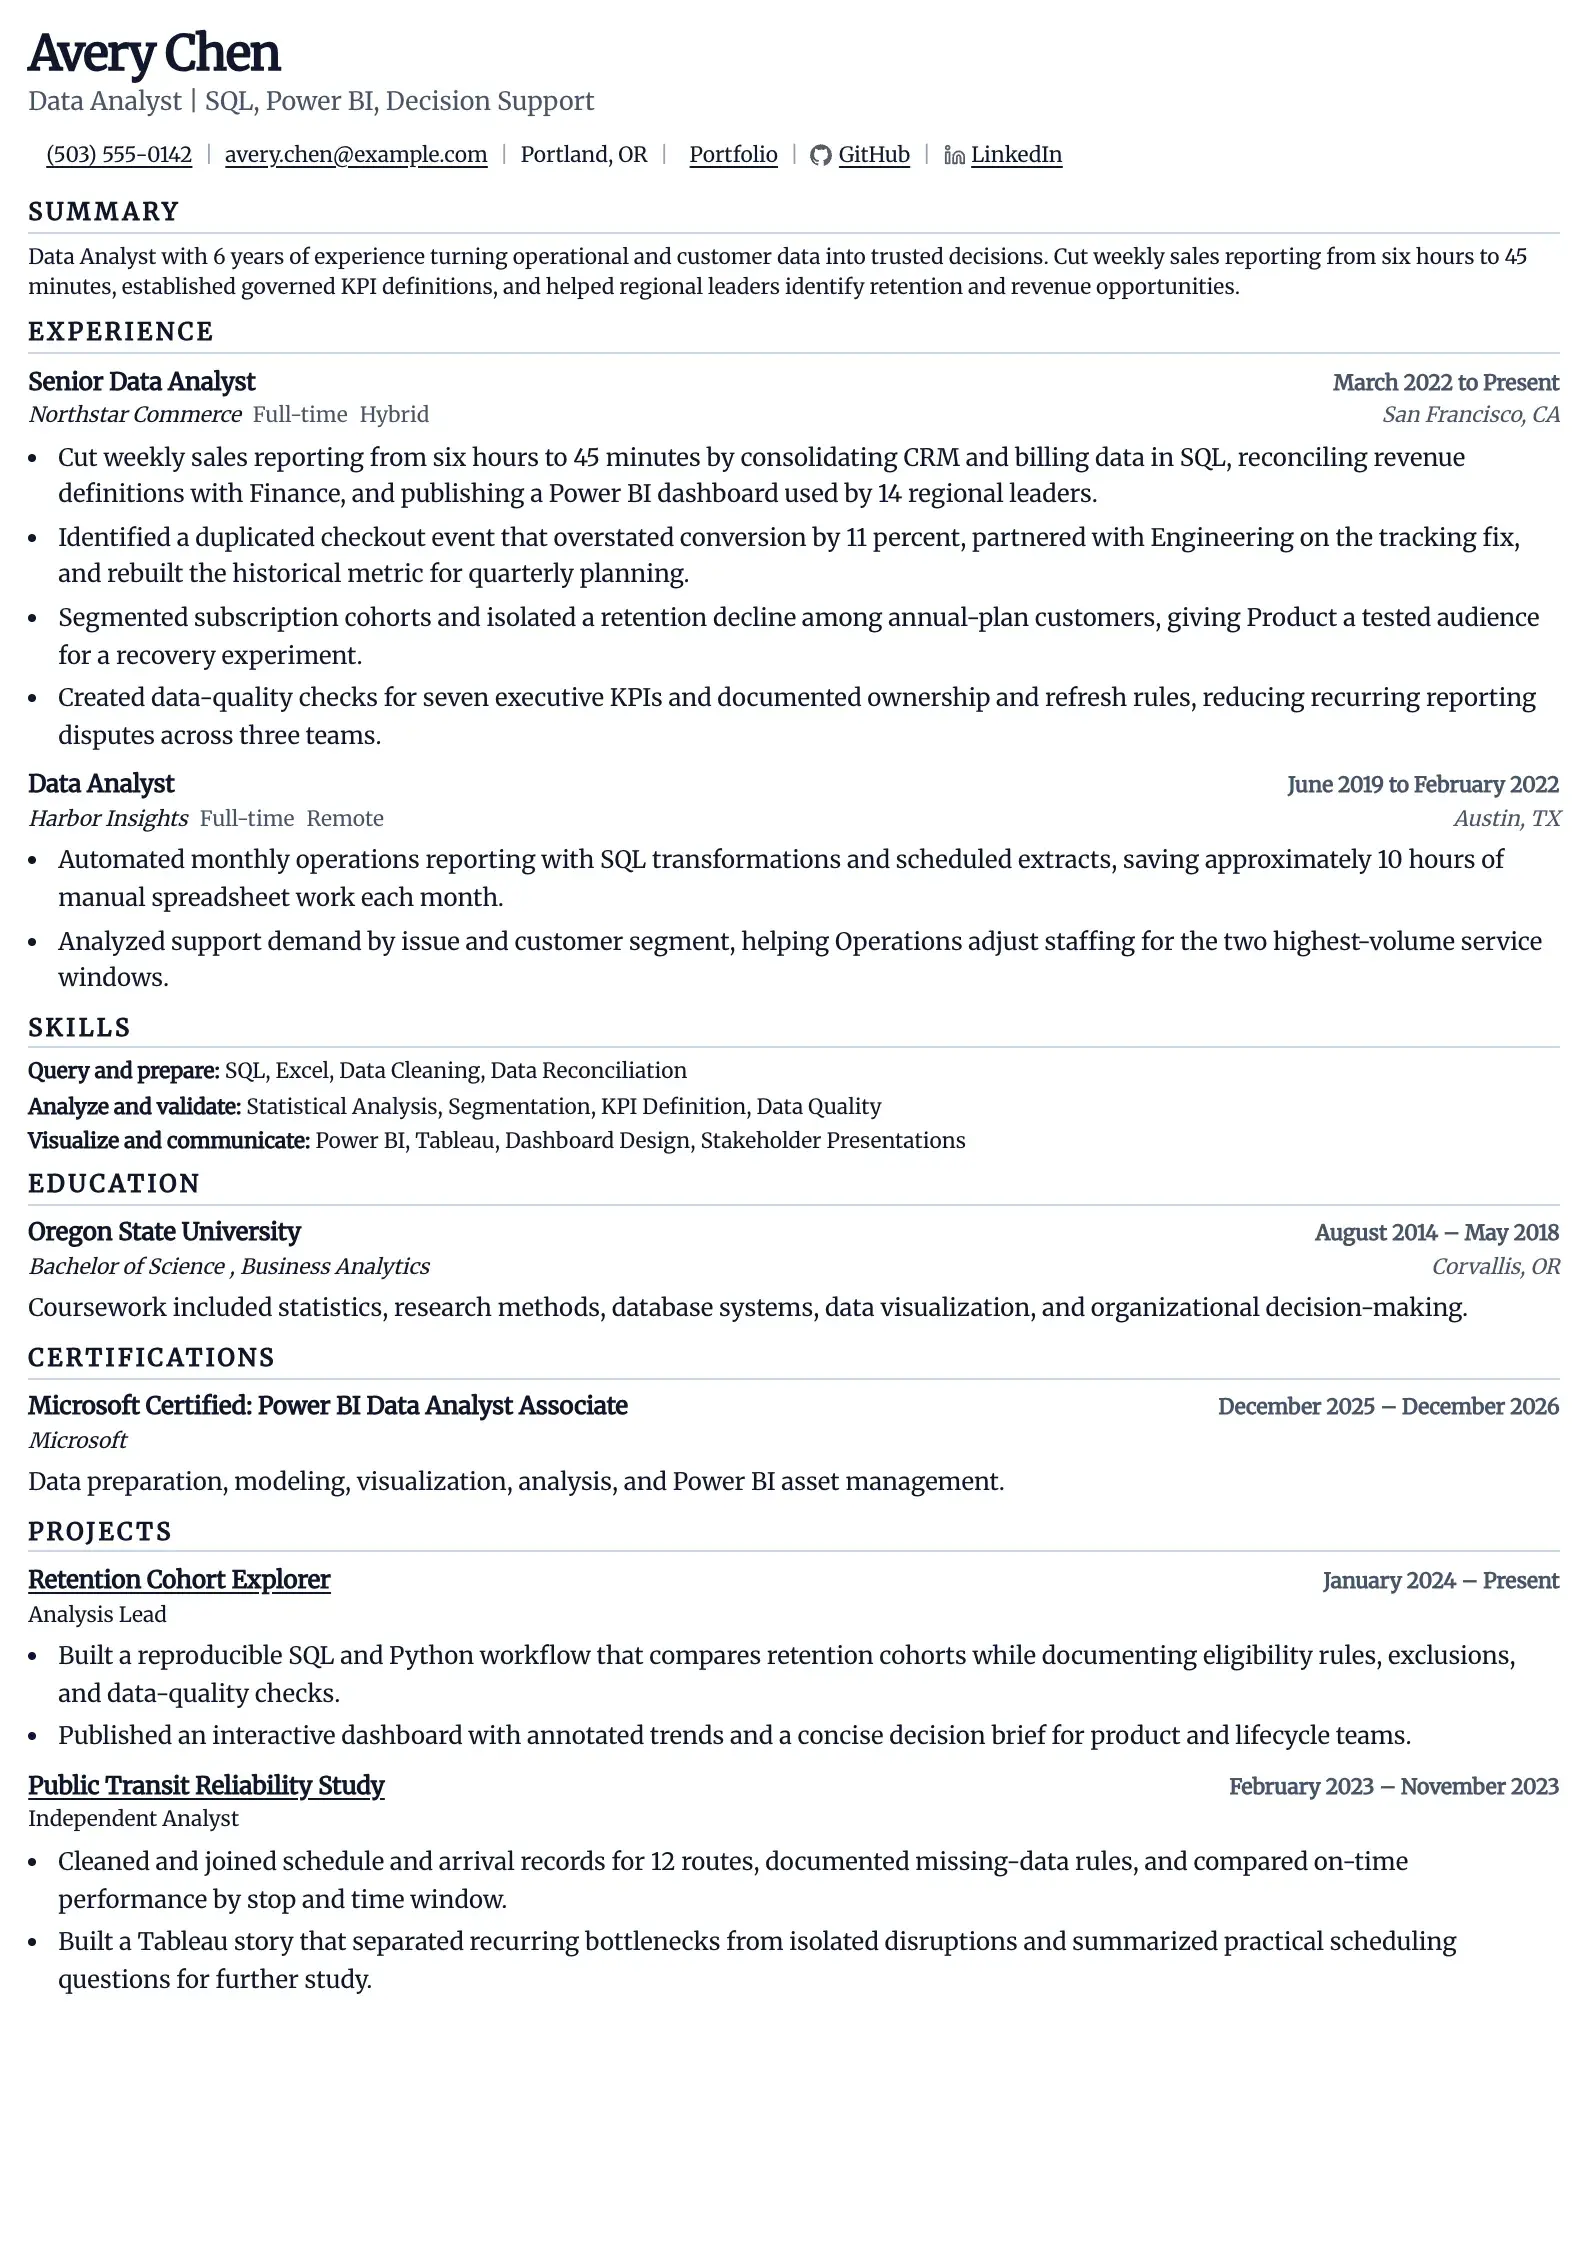
Use this resume template for data analyst applications
Give analytical decisions, methods, and measured outcomes a clear single-column reading order.
What data analyst hiring managers scan first
The first scan usually tests whether your work reached a decision. A dashboard is useful evidence only when the reader can see who used it, what it replaced, and how its definitions were governed. An analysis is stronger when it explains the question and the limits of the conclusion, not only the number of rows queried.
Show judgment around data quality. Useful signals include reconciling totals against a source system, documenting metric definitions, investigating missing values, or identifying a tracking gap before publishing a recommendation. Employers use different stacks, so emphasize transferable analytical habits before adding every tool you have encountered.
Analysis that changed an operating decision
- Hiring signal
- The candidate can produce a trustworthy answer and communicate it at the point where a team chooses what to do next.
- Evidence to show
- Connect the question, source data, validation method, finding, stakeholder, and resulting decision in one compact story.
Skills that prove data analysis depth
Group skills by the work they enable. Querying covers joins, aggregations, window functions, and reusable transformations. Analysis covers segmentation, trend interpretation, experiment reading, forecasting, or other methods that match your actual work. Communication includes metric definitions, dashboard design, written recommendations, and conversations that surface assumptions.
Do not imply that every analyst role requires the same programming depth. Some teams center on SQL and business intelligence tools, while others use Python or R for repeatable analysis. Mirror the target posting, then prove the important capabilities in context.
Query and prepare
- SQL joins and window functions
- Data cleaning and reconciliation
- Reusable data transformations
Analyze and validate
- Segmentation and trend analysis
- Statistical reasoning
- Metric definition and data-quality checks
Communicate and influence
- Dashboard design
- Written recommendations
- Stakeholder presentations
Data analyst achievement bullets with credible evidence
Write bullets around a decision or changed workflow. Begin with the outcome when it is meaningful, then explain the analysis and safeguards that made it credible. Suitable measures include reporting time, adoption, error reduction, revenue protected, cost avoided, conversion change, or the number of teams using a governed metric. Use only figures you can explain.
Before
Created weekly sales dashboards and reports for leadership.
After
Cut weekly sales reporting from six hours to 45 minutes by consolidating CRM and billing data in SQL, reconciling revenue definitions with Finance, and publishing a Power BI dashboard used by 14 regional leaders.
Why it works
The rewrite shows the sources, quality control, delivery method, user group, and a defensible improvement in reporting time.
When an analysis did not produce a direct financial result, describe the decision it clarified. Examples include identifying an unreliable acquisition channel, defining a retention cohort, correcting a duplicated event, or replacing conflicting spreadsheet definitions with one governed metric. The guide to strong resume bullet points can help you keep the action, method, and result connected.
ATS keywords matched to data analyst proof
Applicant tracking system (ATS) language should follow the posting and your evidence. Include exact platform names when relevant, but do not confuse a tool with a capability. “Tableau” becomes persuasive when a bullet shows the governed metric, intended user, refresh process, and decision supported by the dashboard.
Match analyst requirements to defensible proof
| Job requirement | Matching evidence | Keyword |
|---|---|---|
| Build dashboards for business stakeholders | Published a governed sales dashboard used in weekly planning by 14 regional leaders | Power BI dashboard development |
| Write complex SQL queries | Joined CRM and billing sources, added reconciliation checks, and reduced manual reporting work | SQL data analysis |
Review resume keywords before repeating phrases from a posting. Use ATS-friendly resume structure to keep tools and evidence readable by both software and people.
How data analyst evidence changes by seniority
Entry-level candidates can show reliable execution through a well-scoped project, internship, or operational report. More experienced analysts should demonstrate independent problem framing, stronger quality controls, and influence across teams. Senior scope often includes metric governance, analytical standards, mentoring, or a portfolio of decisions rather than simply larger datasets.
- 1
Entry level
- Focus
- Accurate analysis on a bounded question
- Proof to show
- Documented queries, cleaning decisions, validation checks, and a clearly explained finding
- 2
Mid-level
- Focus
- Independent ownership of recurring decisions
- Proof to show
- Stakeholder alignment, reusable reporting, governed definitions, and measurable operational impact
- 3
Senior
- Focus
- Analytical leverage across teams
- Proof to show
- Metric strategy, quality standards, prioritization, mentoring, and decisions improved across a business area
Data analyst resume mistakes that weaken trust
Avoid presenting charts as outcomes. A polished visualization may still rest on unclear definitions or unreliable inputs. Also avoid claiming causation when your work only found a correlation. Precise language such as “identified,” “estimated,” or “supported” often demonstrates better judgment than an inflated claim.
Listing tools without the analytical question
- Why it hurts
- A dense skills section cannot show whether you used SQL or a dashboard to answer a relevant question accurately.
- Better approach
- Use experience bullets to connect each important tool to a question, validation step, audience, and resulting decision.
Protect confidential information. Describe the scale, method, and relative outcome when exact customer or revenue figures cannot be shared. Remove dashboard screenshots that expose internal data, and never invent a percentage to make a routine task sound strategic.
Frequently asked questions
- What should a data analyst put on a resume?
- Prioritize analyses that changed a decision, improved a process, or made reporting more reliable. Name the question, data sources, tools, validation steps, audience, and outcome. Include SQL, spreadsheet, visualization, and statistical skills only when your experience or projects show how you used them.
- How can an entry-level data analyst show experience?
- Use internships, coursework, volunteer analysis, and independent projects built around a real question. Explain how you cleaned the data, selected a method, checked the result, and communicated a recommendation. A small reproducible analysis is stronger than a gallery of unexplained charts.
- Should a data analyst resume include a portfolio?
- Include a portfolio when it lets a reviewer inspect useful work such as a documented SQL analysis, dashboard, or notebook. Curate two or three projects that resemble the target role. Remove unfinished exercises and protect confidential employer data by recreating the method with public or synthetic data.
- Which data analyst tools belong in the skills section?
- List tools required by the posting that you can use confidently, such as SQL, Excel, Tableau, Power BI, Python, or a specific warehouse. Pair the most important tools with bullets that show the query, model, dashboard, or decision they supported instead of relying on a keyword list alone.

Ready to build your Data Analyst resume?
Choose sample data or build your own resume, then personalize it before you download.